146 kPa of pressure-equivalent hysteresis. This is the maximum separation between indicated pressure readings on increasing and decreasing pressure paths, compared at the same applied reference pressure.
Conclusion
The Sketrix A5 value describes a measurement difference. It is not extra pressure created by a circuit-design program, and it is not a quantity that should simply be added to atmospheric pressure. Interpreting it correctly requires separating the pressure supplied to a sensor from the pressure inferred from its output.
A useful analysis therefore starts with the response curve and the calibration that converts output into pressure units. The number can then be compared with the requirements of a particular measurement task. Without the sensor range, operating conditions and acceptance criteria, 146 kPa alone does not establish suitability.
Published sensor results provide scale and context
A soft-pressure-sensor study by Karagiorgis and colleagues in Advanced Intelligent Systems, published online in 2023 and in a 2024 issue, reported 1.53% average hysteresis for its selected 3D-printed PDMS-foam sensor. Its tested operating range was 5 to 170 kPa, with repeatability assessed over 500 cycles. The hysteresis calculation normalised the loading-unloading capacitance difference by the capacitance span. That percentage describes the authors' sensor and procedure; interpreting a pressure-equivalent value requires the corresponding calibration and range.
A 2023 study in Micro illustrates the role of construction. Its PDMS-MWCNT and TPU-MWCNT sensors reached maximum hysteresis values of 13.3% at 275 kPa and 5.6% at 250 kPa, respectively, after five loading-unloading repetitions at 2 Hz. The maxima occurred at different applied pressures. Together, these papers show why a comparison should carry the material, range, cycling conditions and normalisation alongside its headline number. They provide physical-sensor context for interpreting the A5's 146 kPa value, rather than a common leaderboard of interchangeable scores.
Why do we care?
A design model can appear consistent while a physical measurement depends on how the system reached its present state. Suppose an operator approaches a reference pressure from below, records the sensor reading, then approaches the same reference from above. If the readings differ, treating them as interchangeable can conceal an important part of the response.
For a system that uses indicated pressure to make decisions, that difference can affect interpretation near a threshold. Whether it produces a practical problem depends on the application, calibration and control design. A claim about damaged components or shortened service life would need that additional connection to the physical system; a hysteresis number does not supply it on its own.
What is pressure hysteresis?
Hysteresis describes the separation between the increasing-input and decreasing-input responses at equivalent input points. WIKA's pressure-measurement handbook, page 61, explains the pressure-measurement definition. The comparison concerns the direction of approach, rather than merely the passage of time after a pressure change.
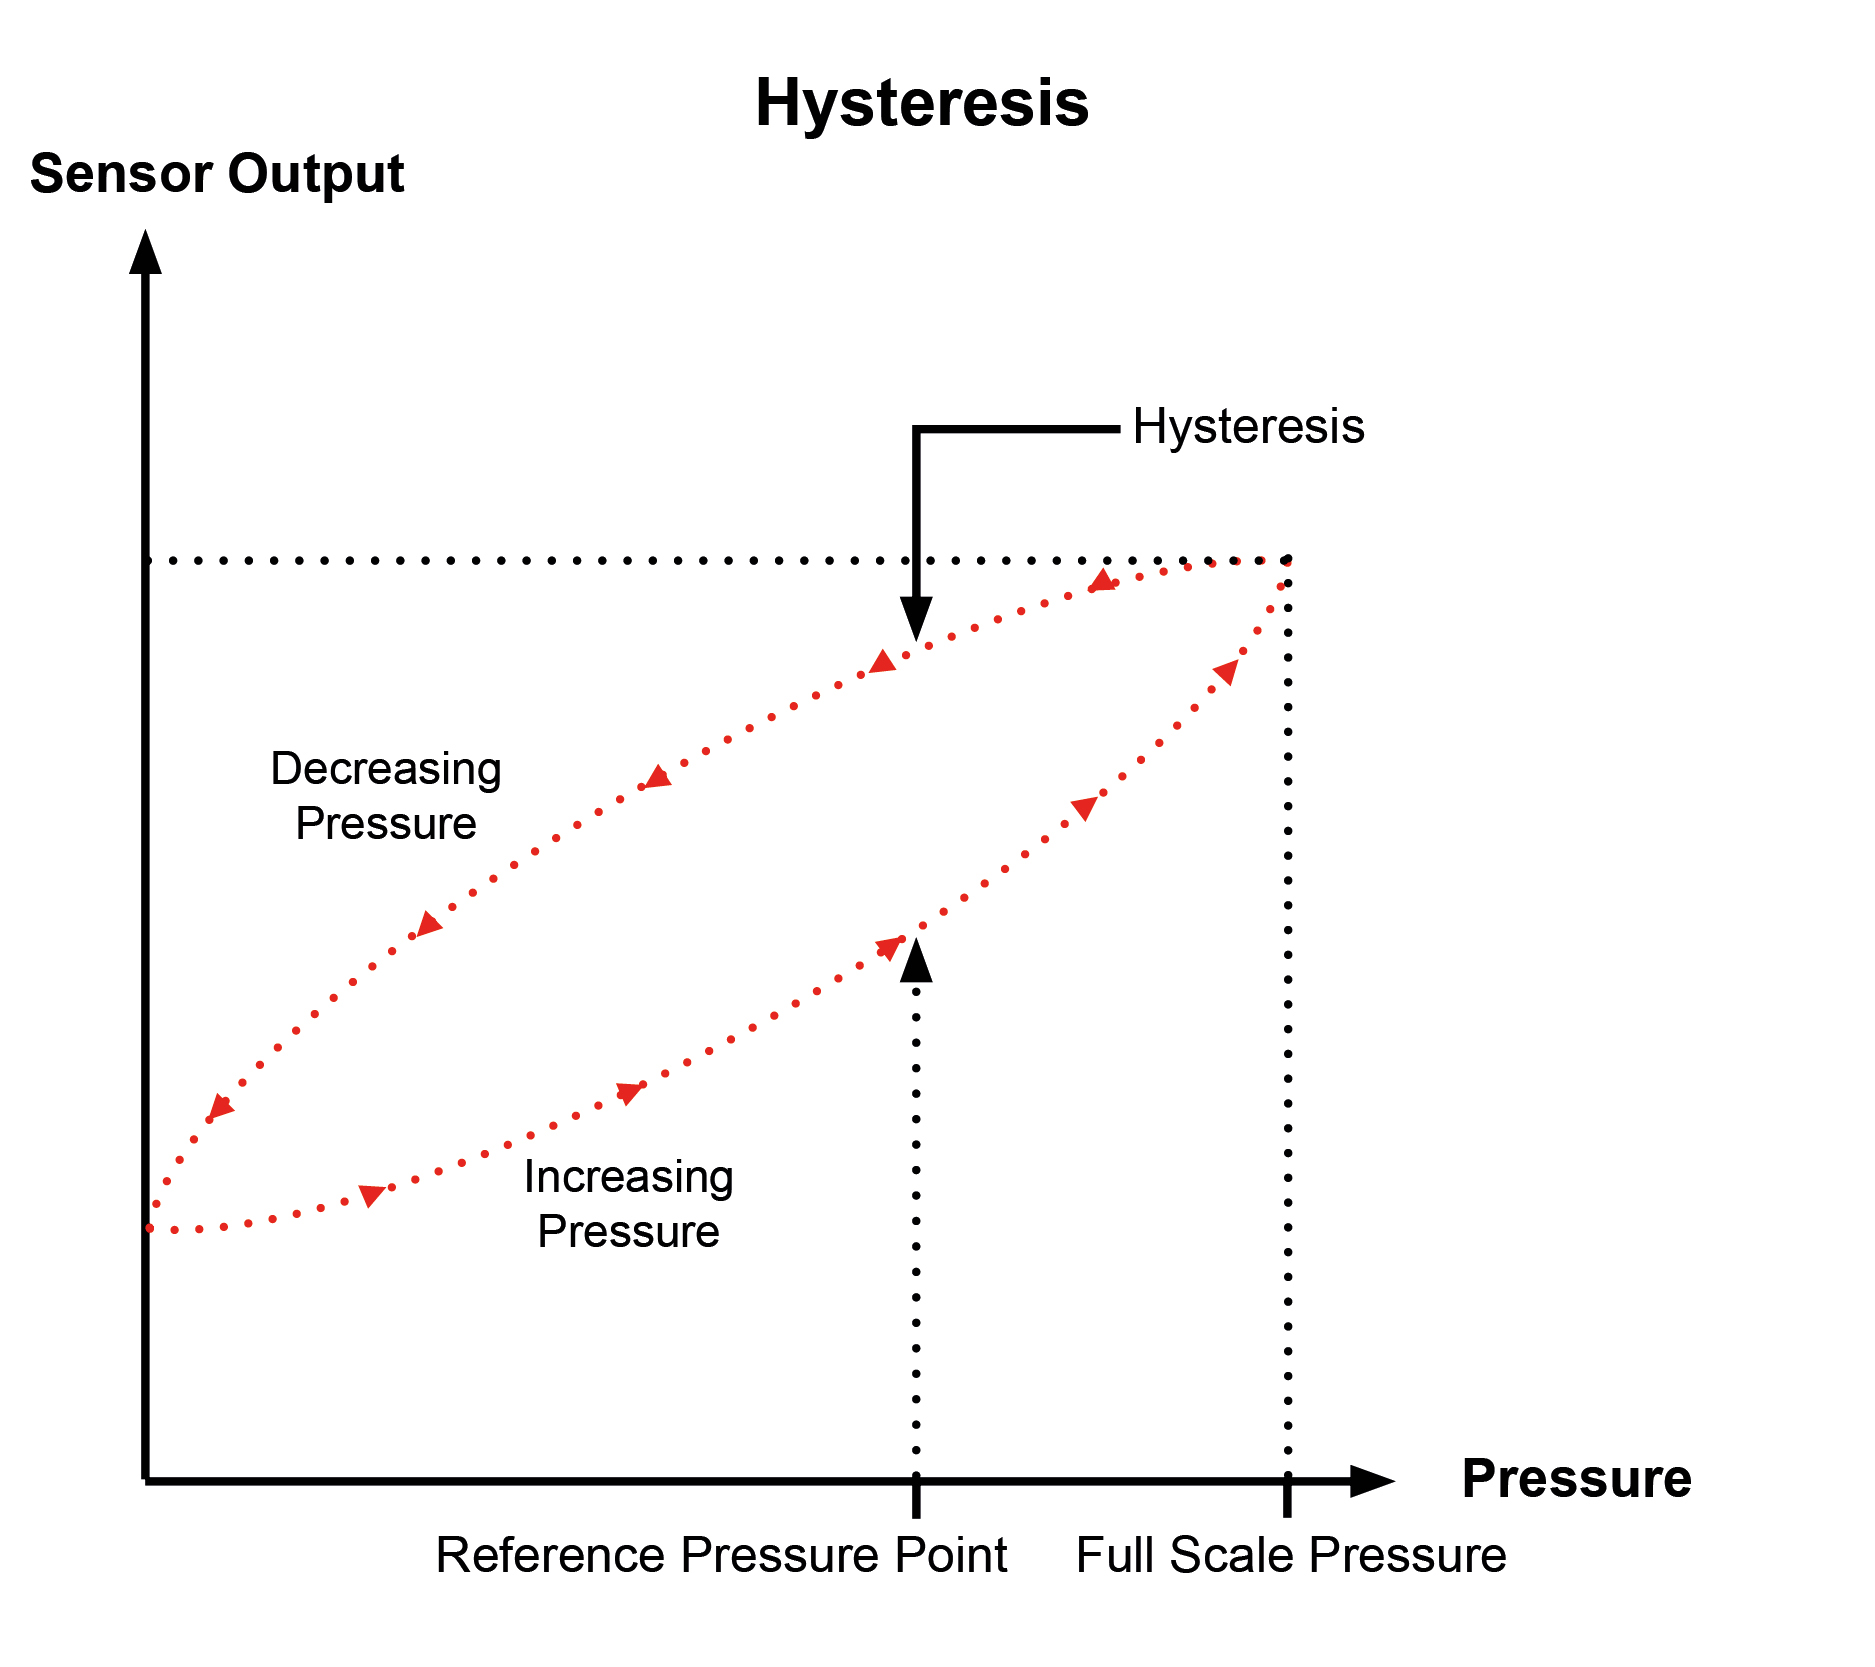
That distinction prevents two different questions from being combined. A settling-time check asks how long a reading takes to stabilise after the input changes. A hysteresis check asks whether the stabilised reading at a given input depends on the path used to reach it. An experiment may need to examine both, but it should record them separately.
Measurement design
Use a calibrated pressure reference and a documented measurement range. Select reference points across that range, approach them in an increasing sequence, and repeat the sequence in decreasing order. Apply the same settling rule at each point. Record the reference pressure and the sensor's indicated pressure together so that equivalent inputs can be paired later.
Temperature should be recorded rather than treated as an unspoken constant. So should the sensor configuration, calibration, resolution, mounting arrangement and acquisition settings. If a component or configuration changes between runs, record the change before comparing the results. An unexplained difference between runs is not automatically an effect of hysteresis.
Repeated cycles help reveal whether the response is consistent, but the repeat count must describe work actually completed. Keep individual readings rather than only a final maximum. A summary value is easier to assess when somebody else can inspect the pairs from which it was obtained.
Reading the result
For each reference point, subtract the decreasing-path indicated reading from the increasing-path indicated reading and take the absolute value. The largest paired difference is the maximum hysteresis under the stated definition. Where the output begins as voltage or a digital count, the calibration must first establish how that output maps to pressure.
| Quantity | Role in the comparison |
|---|---|
| Applied pressure | Common reference input for a pair of readings |
| Increasing-path indication | Reading obtained while approaching from below |
| Decreasing-path indication | Reading obtained while approaching from above |
| Maximum absolute separation | 146 kPa for the A5 value discussed here |
Do not subtract readings taken at unrelated reference pressures and call the result hysteresis. Equally, do not convert the figure into a percentage of full scale until the full-scale range is known. The units may look familiar while the underlying comparison is still wrong.
Investigating a change
If the paired separation changes after a configuration update, first check the reference, calibration and recorded conditions. Then repeat the controlled sequence with one factor changed at a time. A different sensor, a different acquisition interval and a different temperature in the same run make it difficult to identify which change mattered.
It is useful to preserve both the raw output and its calibrated pressure value. That gives an investigator a way to distinguish a change in sensor output from a change introduced by the conversion or reporting process. Plot the increasing and decreasing paths against the same input axis, and keep uncertainty visible when it affects the interpretation.
What to carry into the next test
Record the definition beside the number: maximum pressure-equivalent separation at matched input points. Keep the calibration and individual readings with it. Compare against a stated task requirement, and investigate changes through controlled measurements rather than attributing them to software simply because software displays the result.
The Nibvanta recovery-time explanation makes the complementary distinction between a duration and a response difference.